Syllabus Relevance
For Prelims: El Niño, Southwest Monsoon, El Niño-Southern Oscillation (ENSO), Walker Circulation, Heatwaves, Consumer Price Index (CPI), Monetary Policy Committee (MPC), Wet-bulb Temperature, Minimum Support Price (MSP), CRISPR Gene-editing, Urban Heat Island Effect, Food Corporation of India (FCI)
For Mains: Mechanism and impacts of El Niño on India; Steps India must take to minimize damage during an El Niño year
This analysis is based on “As El Niño looms, guard against food inflation” (Indian Express, 23/06/2026). It examines India’s structural agricultural vulnerabilities and the urgent need for supply-side management — from optimizing regional energy corridors to strengthening rural safety nets — to shield the economy from climate-induced macroeconomic disruptions.
Introduction
Syllabus Relevance
For Prelims: El Niño, Southwest Monsoon, El Niño-Southern Oscillation (ENSO), Walker Circulation, Heatwaves, Consumer Price Index (CPI), Monetary Policy Committee (MPC), Wet-bulb Temperature, Minimum Support Price (MSP), CRISPR Gene-editing, Urban Heat Island Effect, Food Corporation of India (FCI)
For Mains: Mechanism and impacts of El Niño on India; Steps India must take to minimize damage during an El Niño year

What is El Niño?
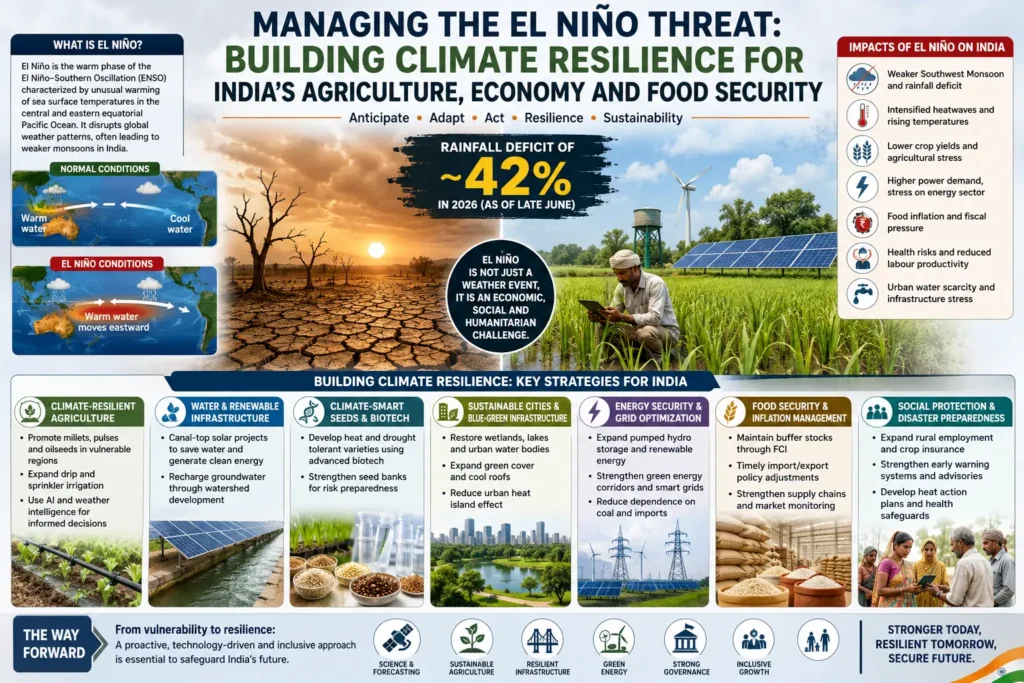
El Niño (Spanish for “The Boy” or “The Christ Child”) is a naturally occurring climate pattern marked by the abnormal warming of surface waters in the central and eastern tropical Pacific Ocean. It forms the warm phase of a broader cyclic phenomenon called the El Niño-Southern Oscillation (ENSO). Though it originates in the equatorial Pacific, it functions as a massive thermal engine that reshapes global atmospheric circulation, triggering extreme weather across continents.
Its counterpart, La Niña (“The Girl”), represents the opposite phase — an amplification of normal atmospheric and oceanic conditions, typically bringing cooler-than-average Pacific temperatures.
Atmospheric & Oceanic Conditions: Normal vs. El Niño Years
Feature | Normal (Non-El Niño) Conditions | El Niño Conditions |
Trade Winds | Strong, blowing east to west (South America → Asia/Australia) | Weaken, stall, or reverse into westerly wind bursts |
Ocean Surface Temperature | Warm water pools in the western Pacific; eastern Pacific stays cool | Warm water shifts eastward toward South America via Kelvin waves |
Coastal Upwelling (S. America) | Strong upwelling brings cold, nutrient-rich water to the surface | Warm water caps the eastern Pacific, suppressing upwelling |
Atmospheric Convection & Rainfall | Rising air creates low pressure, clouds, and heavy rainfall over Indonesia/Australia | Rainfall locus shifts east to the central/eastern Pacific |
Pressure Systems | High pressure over eastern Pacific; low pressure over western Pacific | Pressure drops in the central/eastern Pacific; rises over the western Pacific |
How is El Niño Monitored?
Index | What It Measures | El Niño Threshold |
Oceanic Niño Index (ONI) | 3-month running average of Sea Surface Temperatures (SST) in the east-central tropical Pacific (120°–170°W, 5°N–5°S) | SST anomaly of +0.5°C or higher for 5 consecutive overlapping 3-month seasons |
Southern Oscillation Index (SOI) | Air pressure differences between Tahiti (central Pacific) and Darwin, Australia (western Pacific) | Consistently negative SOI values indicate El Niño (lower pressure in the east, higher in the west) |
Global Impacts and Teleconnections
Because the atmosphere is globally interconnected, shifts in tropical rainfall bands alter jet streams worldwide — like a boulder dropped into a stream. The resulting widespread effects are called teleconnections:
- South America (Peru, Ecuador, Brazil): Severe floods and landslides batter the arid coastal deserts of Peru and Ecuador, while northeast Brazil faces intense drought.
- Australia & Southeast Asia: Suppressed monsoon systems trigger severe droughts, heatwaves, and forest fires. Indonesia’s major historic fires have strong links to El Niño.
- North America: The polar jet stream shifts northward; the Pacific jet stream extends across the southern US, bringing wetter winters to the south while the northern US and western Canada experience unusually warm winters.
- Africa: East Africa (Kenya, Tanzania) sees increased rainfall and flooding, while Southern Africa (Zimbabwe, South Africa) faces devastating droughts threatening food security.
Interaction with Climate Change
El Niño years frequently set records as the hottest years in human history because El Niño releases enormous quantities of stored ocean heat into the atmosphere. While scientists are still investigating whether climate change increases the frequency of El Niño events, growing consensus holds that it significantly increases their intensity — producing more volatile swings between hyper-arid droughts and catastrophic rainfall.
What Are the Consequences of an El Niño Year for India?
Rainfall Deficit and Temporal Asymmetry
The primary impact of El Niño on India is the suppression of the Southwest Monsoon (June–September). Under normal conditions, rising warm air over the western Pacific creates a low-pressure zone that draws moisture-laden winds across the Indian Ocean toward India. During El Niño, the Walker Circulation shifts eastward, creating a descending limb of dry air over the subcontinent and generating anomalous high pressure that blocks cloud formation.
- All-India cumulative rainfall for June–September 2026 is approximately 42% below the normal average as of late June.
- Global climate agencies predict the current El Niño will intensify into a “strong” event by August–September and a “very strong” event over October–January.
- Historically, strong El Niño events — such as those of 2015–16 and 2023–24 — have produced drought years across India.
Intensified Heatwaves and Prolonged Summer Windows
El Niño alters pressure gradients over the Indian Ocean, delaying standard sea-breeze cooling mechanisms. This results in:
- Multi-day heatwaves across Central, Northwestern, and Eastern India, with temperatures frequently exceeding 45°C.
- Historical data shows daily maximum temperatures above 40°C persisting for 30–45 days, as observed in 2015.
Energy Sector Vulnerabilities
- Reduced rainfall lowers reservoir storage, causing a significant drop in hydroelectric power generation (normally ~10–12% of India’s power mix).
- Concurrent heatwaves drive cooling demand (ACs and fans) to record highs, pushing India’s national peak power demand past 240 GW.
- The government is forced to lean heavily on coal-fired thermal plants, driving up spot electricity prices on the Indian Energy Exchange (IEX) and raising industrial operational costs.
Industrial and Macroeconomic Disruptions
- With ~45% of India’s workforce dependent on agriculture, reduced farm yields dry up rural disposable income, causing a measurable drop in sales of FMCGs, two-wheelers, and entry-level tractors.
- Major industrial clusters — steel plants, textile units, chemical refineries — depend on river and reservoir water. When levels fall, local governments prioritize drinking water, forcing factories to cut production.
Monetary Policy and Fiscal Strain
- Supply-side food inflation (sharp price spikes in vegetables, pulses, and cereals) raises headline CPI, constraining the RBI’s Monetary Policy Committee (MPC) from cutting interest rates and keeping borrowing costs high.
- On the fiscal side, the government must expand safety nets: higher allocations for rural employment schemes (e.g., VB-G RAM G), along with costly market interventions like reducing import duties on edible oils and pulses.
Public Health and Labor Productivity
Extended El Niño heatwaves elevate wet-bulb temperatures — the metric combining heat and humidity that determines whether the human body can cool itself through perspiration. When this threshold is breached, outdoor physical labor becomes dangerous.
Research indicates that daytime productivity declines by 2–3% for every degree the Wet Bulb Globe Temperature (WBGT) rises above 20°C — severely impacting construction, real estate, and logistics sectors.
Urban Infrastructure Costs
Dwindling groundwater tables and poor reservoir retention trigger severe municipal water crises in major economic and tech hubs:
- In Bengaluru, rapid urbanization and over-extraction have caused groundwater levels to drop from 300–400 feet to over 1,200 feet in some areas.
- Chennai captured global attention in June 2019 when all city reservoirs ran completely dry — what officials termed “Day Zero” — forcing the government to haul water via trains from over 200 km away.
How Can India Prepare and Minimize the Damage?
Upgrading to Climate-Resilient and Algorithmic Agriculture
- Use MSP signaling to incentivize a shift away from water-intensive crops like sugarcane and paddy in vulnerable zones (e.g., Marathwada, Western UP) toward millets (which require 70% less water than rice), oilseeds, and pulses.
- Scale up drip and sprinkler irrigation to minimize evaporative loss during prolonged monsoon breaks.
- Integrate AI-driven predictive modeling with district-level extension services so farmers can adjust sowing windows, seed selection, and fertilizer application based on localized rainfall timelines.
Constructing Solar-Oasis Canopies over Major Irrigation Canals
Canal-top solar power plants create an efficient circular infrastructure loop:
- Solar panels physically shield canals, drastically reducing evaporative water loss.
- The flowing water beneath naturally cools the panels, increasing solar generation efficiency during peak summer demand.
- This dual-purpose infrastructure simultaneously addresses water scarcity and the energy deficit caused by reduced hydropower.
Scaling Precision Agri-Biotech and Climate-Smart Seed Vaults
- Invest in public-sector genetic research using CRISPR gene-editing to accelerate breeding of climate-resilient crop varieties.
- Flood domestic supply lines with seeds engineered for high heat tolerance and shortened maturity windows, ensuring viable harvests even when the monsoon arrives late or ends abruptly.
Mitigating the Urban Heat Island (UHI) Effect via Blue-Green Infrastructure
- Municipal planning must prioritize blue-green infrastructure: restoring urban wetlands and floodplains to recharge city water tables.
- Mandate reflective “Cool Roof” building codes and expand urban tree canopies and green belts to lower ambient temperatures, reducing both the heat island effect and the energy load on municipal power grids.
Dynamic Power-Mix Optimization and Grid Management
- To offset drops in river-fed hydropower, maximize Pumped Hydro Storage (PHS) plants and cross-state transmission networks.
- Utilize regional Green Energy Corridors to route surplus solar energy from western states (Rajasthan, Gujarat) to central and southern industrial zones — keeping IEX spot prices stable and reducing dependence on costly thermal coal imports.
Macroeconomic and Supply-Chain Buffer Optimization
- Maintain strategic reserves of essential food commodities (pulses, onions, wheat) through the Food Corporation of India (FCI) for timely open-market interventions that temper retail food inflation.
- Establish clear, data-driven triggers for adjustments to import duties and export quotas to stabilize domestic supply lines before hoarding behavior escalates in wholesale markets.
Conclusion
El Niño poses a multi-sectoral challenge to India — simultaneously threatening agricultural productivity, water security, energy stability, and macroeconomic health. Addressing this vulnerability demands moving decisively beyond reactive measures toward structural resilience. By integrating climate-resilient agriculture, blue-green urban infrastructure, and dynamic grid optimization, India can insulate its economy from compounding climate shocks and secure long-term sustainable growth.